Anyways, I have been googling a lot on new ideas that are running in my mind, things like COGNOS to new ways of presentations to gaming and apps. It has been crazy but there is so much stuff available out there.
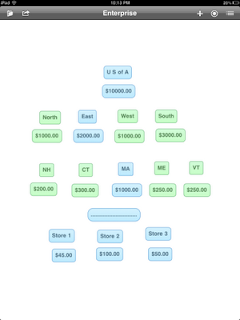
Just created a report that will show the hierarchy levels on a data in a tree format. (the image explains better) assume you want to look at the revenue of the entire organization (USA) and specifically look at each sub level regions to see where you might have the best and worst revenue generated. (more like conditional blocking.... A simple red for below avg and green for above avg) This tree structure helps you to drill down and drill up at any level and all the blue cubes show the path of drill down.
This kind of report can be created on relational database / report studio 8.3 / simple lists / some conditional blocking. Email me if you want to implement this.Been lazy to replicate it on sample data and upload the XML. Will do it in future.


