Saturday, September 10, 2011

IBM COGNOS Report Studio List / Block with a scroll bar without Java Script


COGNOS Report Studio has a million options to create a report; but we only explore a few depending on our needs. 
In most of my reports (8.3 / 8.4 / 10 versions) I try to use some java scripting to the lists or graphs in order to make them look better. The problem that I face is, when the list moves to the next page, the scripting does not work as efficiently as it should. Check the image 1 & 2.
So the solution to this is;
1. Put the list  / graph / crosstab into to a block
2. Go to the properties pane and select the 'Size and Overflow'
3. Choose 'Use scrollbars only when necessary' 
It is as simple as that.
 
F Y I ---- Screen shot based on junk data.

Friday, September 2, 2011

IBM COGNOS Java script for auto refresh of a report in a COGNOS viewer / bringing the concept of live feed to COGNOS report studio.


I came across this script in the IBM COGNOS documents that lets you automatically refresh the report data depending on the time interval that we have selected.  This script would especially be useful for someone who works on transactional data or someone is trying to work on alerts on a report. (Alerts on a report can be achieved through Metric Studio but this script here helps us achieve the same in a report studio.)
Let me put in a story line so that we have a concept that we can sellJ.  A good example for this would be to calculate the check-in and check-out times. Here our goal is to minimize the avg wait time the guest has to wait. So we can build a report with guess no check-in, check-in time, checkout-time, time taken to process, expected process and delta (difference between check-in and check-out).  Just like the RMV or customer care call where they tell us the avg time.
The screen shot above explains a different scenario where we are counting no of guests attended by each employee. A team lead or a manager has a target for the day (for each team member) and he can keep track of their work with this live feeder report; no need to run the report every now and then. We can set the auto refresh time (which is 2 minutes in this case) and project the report on a TV in the roomJ. Taking things positively, the manager can help out the employee who might be stuck with one guest for a long time.
Implementing the report; copy the java script image ‘Script for COGNOS Report Studio Auto Refresh ‘ and add it to the report studio in a HTML tag from the toolbox.(I am not able to upload the script file will do it ASAP)  Now create your regular report.
 TIP --- Add footer to the report with timestamp; this way it will let the user know when the report was last run.

Friday, July 29, 2011

bringing tree structure into report studio IBM COGNOS (Writing positive and creative stuff)

  
When I started writing my professional blog my mindset was to write all the issues that I come across, especially to help out newbies out there. Most of the blogs that I have written so far are issue oriented and very few blogs where I have written some creative stuff. Off late, the issues that I come across seems to be very silly and I don't get enough critical issues to write on the blog.

Anyways, I have been googling a lot on new ideas that are running in my mind, things like COGNOS to new ways of presentations to gaming and apps. It has been crazy but there is so much stuff available out there.

Just created a report that will show the hierarchy levels on a data in a tree format. (the image explains better) assume you want to look at the revenue of the entire organization (USA) and specifically look at each sub level regions to see where you might have the best and worst revenue generated.  (more like conditional blocking.... A simple red for below avg and green for above avg) This tree structure helps you to drill down and drill up at any level and all the blue cubes show the path of drill down.

This kind of report can be created on relational database / report studio 8.3 / simple lists / some conditional blocking. Email me if you want to implement this.Been lazy to replicate it on sample data and upload the XML. Will do it in future.

Thursday, July 21, 2011

Tight Integration of IBM COGNOS within an application


The basic idea is to bring the reports to the user and not asking the user to go the reports .  Integrating BI into your application always help. The project had few things:

End users don't have to go to a different location to run their reports.  
Tighter integration for security
Utilization of the BI GUI
P.S - No SDK required

Let me put down an example / scenario

You have a portal where business users login. Here, you want them to view few specific reports that can alert them. In my case the front end of the application is java and I am familiar with simple java coding. What we did here is, using iFrames we pass the URL of the report with the prompt values ( for security reasons). So as soon as this link is clicked, it runs the cognos report. we have given a small window size of 400 by 400 for the cognos viewer and have designed the reports accordingly. Believe me, it has come out beautifully and the performance is amazing as the framework was designed based on these particular reports. Only disadvantage here, the end user cannot open anything but just watch the cognos viewer. No print options, no email, no output formatting etc. Advantages , it's lighting speed, security, GUI.

I have tried to put a rough sketch of how it looks. The red section is where you will see the cognos viewer.  Each individual box here is a separate report and not 1 single dashboard. This way the user can drill down on individual report without affecting the other. 

Friday, July 15, 2011

Making things easier – IBM COGNOS 10


I have worked on 8.3 /8.4 versions of COGNOS extensively. We have started work on IBM COGNOS 10 and I realize that they have got in some really good tools in the report studio. Especially the tab control option that I want to mention today.

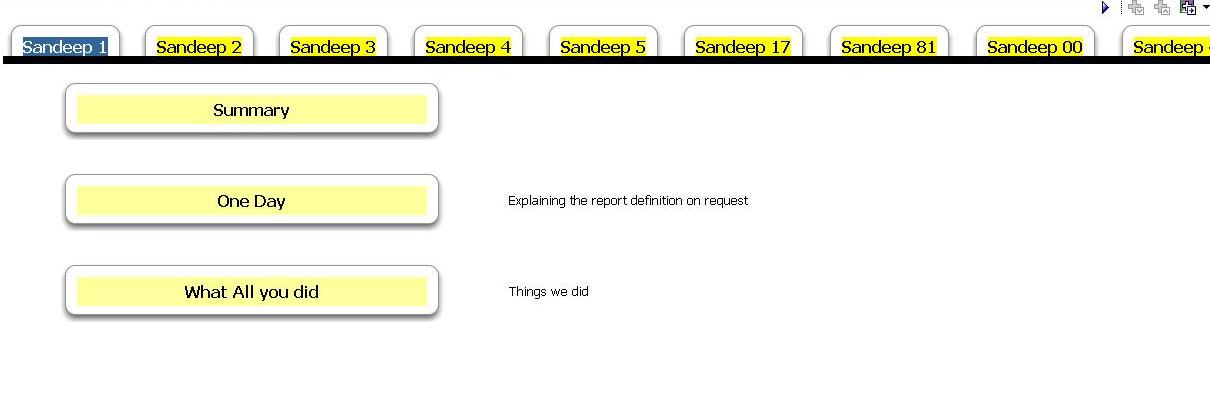
In 2009 we had designed a report that would work more like a tool than a simple report. So I used java scripting and iframe to make that report work. An end user would not know if it was a tool or a COGNOS report. I spent considerable amount of time (2 weeks) to design the layouts and colors.

The image here, which has ‘Sandeep’ as tabs was created on report studio 8.3; with each tab giving you access to a different domain of the canned reports. Now, we have the same concept in IBM COGNOS 10 as Tab Control and it is so simplified ---Just drag and drop. I am so glad that this feature has been added but also envy because of the ease of availability to all now :).

Anyways, the other thing that I am working on is the iPad version of IBM COGNOS 10 reports using only report studio. (Please note – no SDK involved here). I see that the reviews online claim that IBM COGNOS 10 is more mobile friendly, but I haven’t seen any major changes in the basic release version. The only thing that has inspired me is the Business Insight, which we were about to design in the with the help of some Java. Our concept was more like a portal for COGNOS reports. Coming back to iPad, I have designed the templates (on 8.3 COGNOS) but am still looking for some good images that would enhance the look and feel. I will soon put in a video to demo this feature.

Tuesday, June 7, 2011

Apple crazy and integrating Business Intelligence on iPad

I read an article recently which said " Apple fan following is like a
religion". The study showed, when the apple fans spoke about the apple
product or a religious person spoke about his religion; the exact
brain cells activated for both of them. Such a strange fact.

         Personally  I have some friends who where anti apple when the
iPod came out. They hated it more when the iPhone came. But guest
what, I was planning to create an apple app but found out that these
guys have already started the ground work. That is how influential the
environment around people can be. People who used to hate it, love it
after actually using it. Another fact, most of my friends you have
photography as an hobby end up buying one of the mac machines and
later buy SLR camera. One more thing, they have all gone to
photography classes also. Crazy guys.

The reason I am writing this blog today is also because of the fact
that I wanted to create a simple app icon on the home screen of a
iphone / ipad that could lead me to my personal website / home page.

I achieved what I wanted. At least The initial steps. I am so glad.By
profession I am a Business intelligence developer, I work on reporting
platform, data warehousing. I have lost touch with the core coding. I
do write simple java based codes or scripting or jsp but not the C++
level.

I designed the template of the IBM COGNOS 8 reports to fit into the
mobile safari. Basically a web based application.  A dynamic icon is
created with the exact report name that you would have created. This
way, the end user is only a touch away from his reports. Cannot
discuss anything else. CONFIDENTIAL. I am working something similar on
my personal website (which is not for commercial usage) and I will try
to put some screen shots.

 Click on the app icon, enter user name password and your report is
ready.  Simple isn't it.

I certainly think this is a great idea to integrate Business
Intelligence and the iPad users in the most cost effective way.

Sent from my iPad :)

Wednesday, January 19, 2011

FactFinder Internal Error: loop in the join path IBM COGNOS Error

This is an example of poor --- very poor framework management. I was actually working on creating some metadata for a custom report and I had only half day time to test it, The report needed an humongous amount of details from various tables and performance was a major issue.

 I tried creating metadata from existing metadata in the import layer. When I create new relationship for the 2 new tables which I added for this report, there was a loop issue. Of course when you check the query subject on Framework Manager -- Launch Content Explorer; it does not show any loop. So now, I had to create redundant data in the import layer just for this report in order to accommodate the new query subject and avoid loops. Given more time we could have avoided this by re mapping some of old query subject relationships.

Lesson learn :) ---- Avoid joins to the same query subjects in the import layer. Always look at the base query subject and not the derived once in development layer or the second layer of the Framework Manager.

Anyways, I could find the issue fast and it was an easy solution. Way to go !!!!!